Shipping analytics that turn data into decisions
Ship smarter with shipping analytics that are built into Stamps.com. Track all the metrics that matter most to you and quickly share the results across teams to improve decision making. Use pre-made reports to view mailing history, expenses, and balances, then export shipping analytics to CSV for deeper analysis in your preferred tools.

See what is working, fix what’s not, and prove impact
Make more informed decisions by using shipping analytics reports that you can filter, segment, and export. Compare services, control costs, and keep stakeholders aligned with simple, consistent reporting you can share with a click of a button.

Cut costs with clarity
Spot spend trends by viewing Expenses and Balances alongside your shipment activity. See funds added, credits, deductions, and ending balances for the time frame you choose and then export the details to a CSV for analysis in your favorite software.

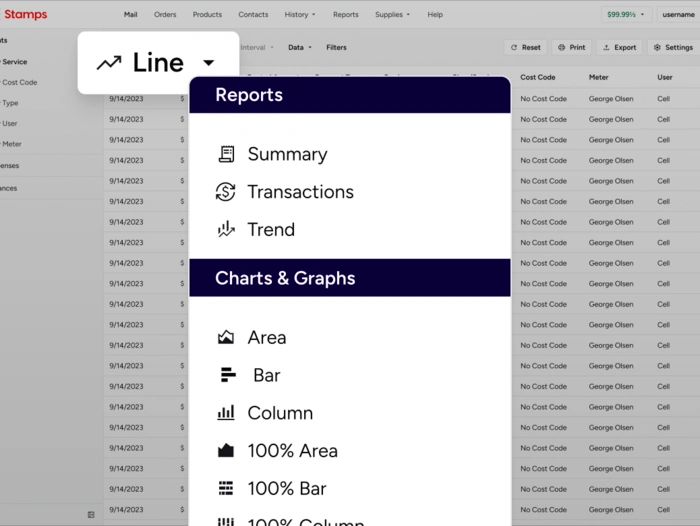
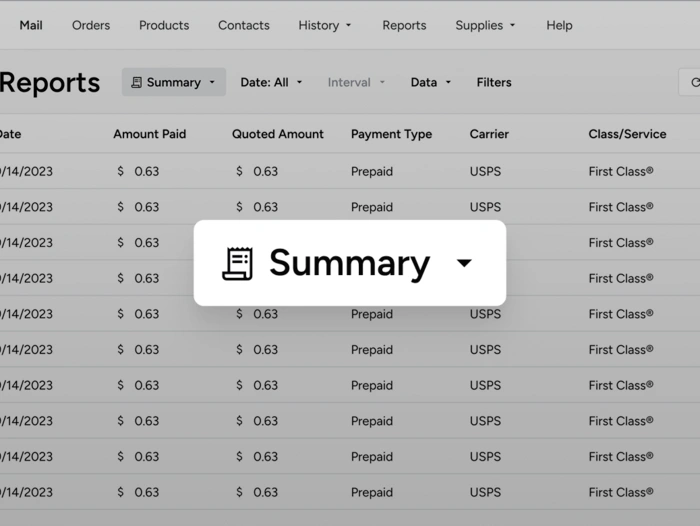
Make informed decisions fast
Choose Summary or chart views, set a date range, and apply filters to surface only what you need. Toggle between dollar amounts and counts to answer questions quickly and share a printable view with collaborators.

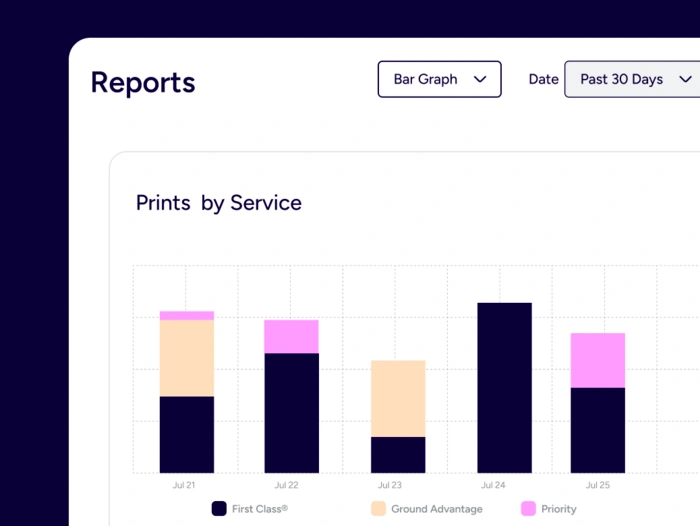
Keep customers and teams aligned
Use the Prints reports to understand volume by service, type, or cost code so you can right size service levels and communicate changes with confidence. Export and distribute results so everyone stays on the same page.
Features that drive actionable insights
Turn daily activity into plans you can act on. Quickly compare carrier performance across USPS, UPS, DHL, and GlobalPost. Stamps makes it possible to optimize shipping operations, visualize transit times, pinpoint shipping costs and streamline order fulfillment across your supply chains.
Gain complete visibility in seconds
View and export your mailing history, expenses, and balances with built-in reports, which support everything from operations to finances. Move from a quick pulse check to deeper analysis in just a few clicks. Share printable summaries to highlight trends in volume, spend, and on-time delivery, or export a CSV to explore the raw data. With consistent definitions across every report, everyone stays aligned—and decisions happen faster.
Compare services across shipments
Analyze performance across carriers, service types, and locations in seconds. Attribute spend, spot trends, and pinpoint where you can save without sacrificing delivery speed. With flexible filters and ready-to-run reports, you’ll uncover insights that reduce costs, improve fulfillment flow, and strengthen carrier strategy.
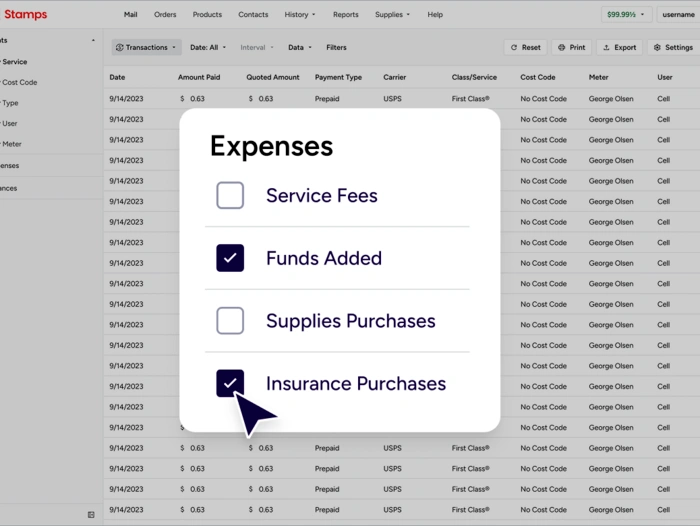
Know where every dollar is going
See exactly where your money goes—from insurance and supplies to fees and taxes. Monitor expenses over time, identify hidden cost drivers, and confirm that operational changes are paying off. With clear, exportable data, you’ll have the insight finance teams trust.
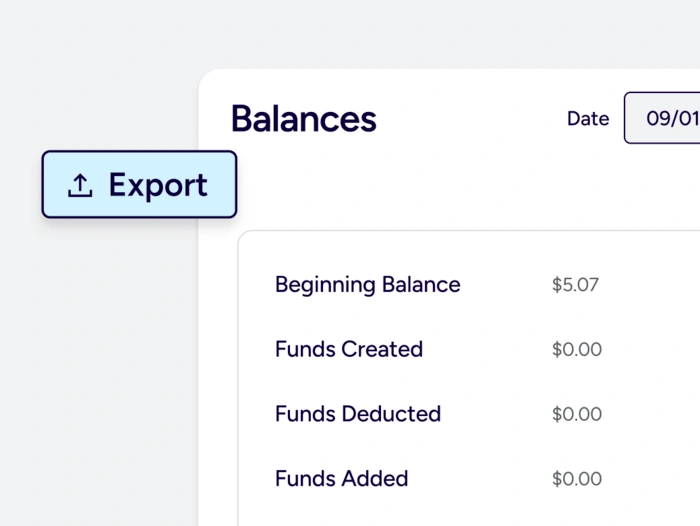
Reconcile credits and expenses easily
Review beginning balance, funds added or credited, deductions, and ending balance, then export for accounting review. Use this report to tie monthly invoices to internal cost centers and resolve discrepancies quickly. Because entries are organized and timestamped, audits are straightforward, close is smoother, and stakeholders trust the numbers you present.
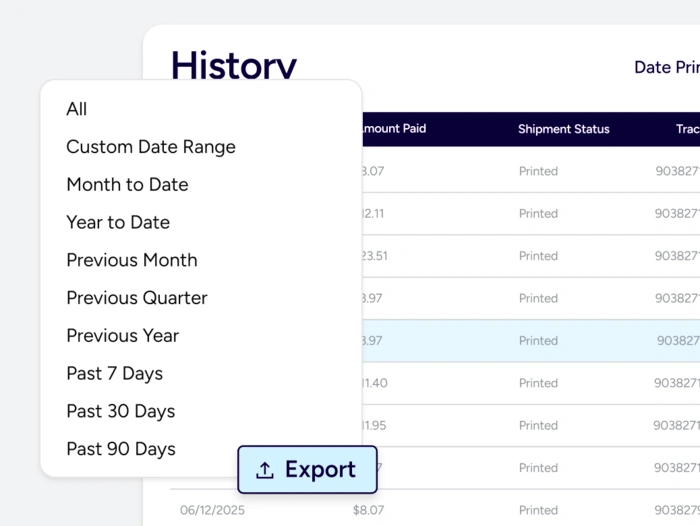
See the trends driving your business
Get clarity fast with flexible date ranges. Select presets like Year to Date or set your own custom range, then switch between yearly, monthly, or daily intervals to uncover trends, spot seasonal peaks, and track new initiatives—all without losing context.
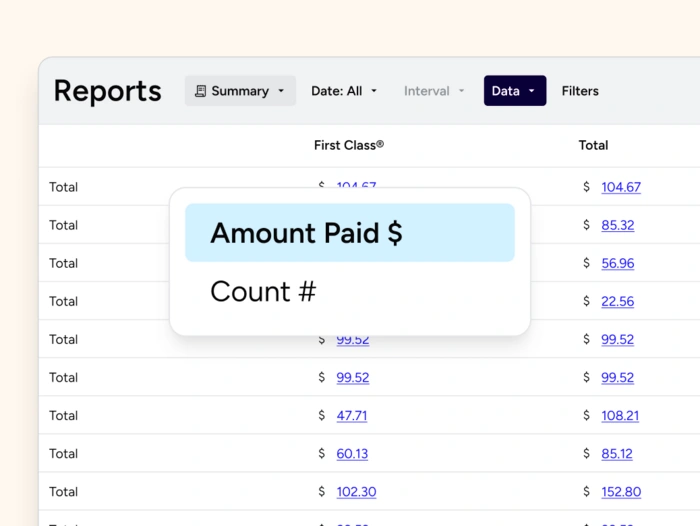
Analyze spend opportunities
Toggle between Amount Paid for total spend and Count for shipment volume to see your data from both angles. Use counts to measure throughput and dollars to uncover margin opportunities. With one click, tailor your view to any audience—from executive reviews to team coaching.
Quickly focus on the data that matters
Cut through the noise and get the reports you actually need. Quickly filter by service, cost code, or expense type to surface what matters most. Print or export polished reports in one click and save favorite filters for recurring reviews. Consistent, shareable insights keep teams aligned and decisions fast—no digging or do-overs required.
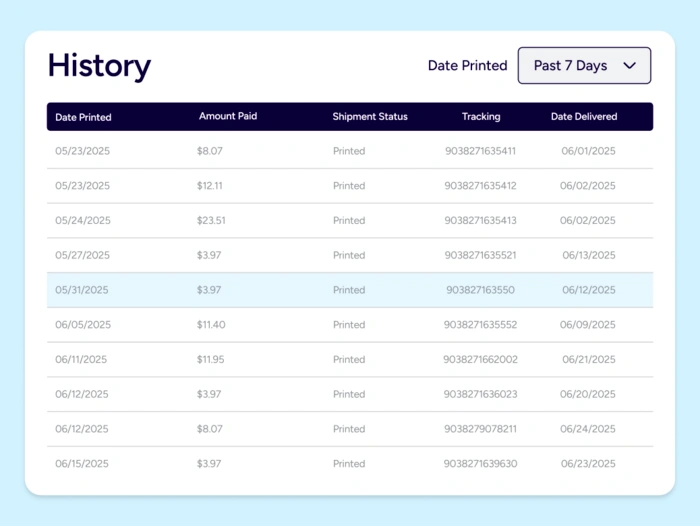
Easily search and export print history
Get the exact data you need—fast. Search by date, status, or eligibility in History, apply filters with Advanced Search, and export your results instantly to CSV. Ideal for customer claims, performance checks, or carrier dispute evidence—no custom data pull required.
Generate year-end reports in a few clicks
Generate your Piece Count Report in minutes—no manual formatting required. Access Reports > Prints > By Meter to create a predefined, compliant file you can export, share, and submit with confidence.
Carriers you trust, rates you can’t find anywhere else
Access pre-negotiated discounts you can’t get in person or with a business account. Save on everything from next-day services to international shipping to do more with your mailing and shipping budget.rn
Frequently asked questions about international shipping with Stamps.com
What can I measure with Stamps.com shipping analytics?
You can track carrier performance, transit times, label volume, spend, balances, and exceptions. These reports turn raw activity into actionable insight you can use to optimize shipping processes and reduce shipping costs.
How does shipping analytics help me achieve cost savings?
By revealing patterns like overspending on certain lanes, improper package sizes, or services that miss on time delivery. You can shift volume, refine packaging, and choose better services. Over time, those changes compound into measurable cost savings.
Can I analyze performance by customer, channel, or cost code?
Yes. Apply filters and cost codes to attribute spend and volume to the right projects or channels. That visibility helps you evaluate promotions, catalog changes, and fulfillment locations with clear, defensible numbers.
Do these reports support real time decision making?
Reports can be generated on demand so you always have the latest available information after label creation. That up-to-date view supports real time style decisions during daily standups or carrier cut-off meetings.
How do I use the data with my BI or machine learning tools?
Export to CSV and drop it into spreadsheets, BI dashboards, or data pipelines. Many teams join shipping data analytics with order and inventory data to model transit times, forecast carrier capacity, or test the impact of new fulfillment nodes which are powerful ways to leverage shipping for growth.
Will this help my customer experience and order fulfillment?
Absolutely. With clearer transit times and exception trends, you can set accurate delivery promises, reduce missed commitments, and enhance customer communication. Operations can fine-tune pick, pack, and ship steps so orders leave on time and arrive as expected.
Can I track international performance, too?
Yes. You can include international labels in reports to evaluate cross-border carrier performance, customs-related delays, and landed cost trends. Use those insights to choose the right services and keep global supply chains running smoothly.
What if leadership wants a quick summary?
Toggle between counts and Amount Paid to present either volume or spend. Print or export a concise summary for a board deck, or share a deeper CSV when stakeholders want to drill into shipping operations at the line-item level.