See today’s discounted USPS rates at a glance. Compare options, estimate costs, and avoid surprises at checkout.
Compare live carrier rates across services to balance speed, tracking, and cost for every shipment.
Compare leading mailing and shipping software, learn essential features, and pick the right platform for growth.
Take our business efficiency quiz to score your operations across 10 key areas. Find out where you're thriving and where you're losing time.
Learn how Lewis & Associates Capital Advisors eliminated time-consuming trips to the post office by implementing Stamps.com's online mailing solution, saving up to 30% on postage costs while reclaiming valuable hours for client-focused work.
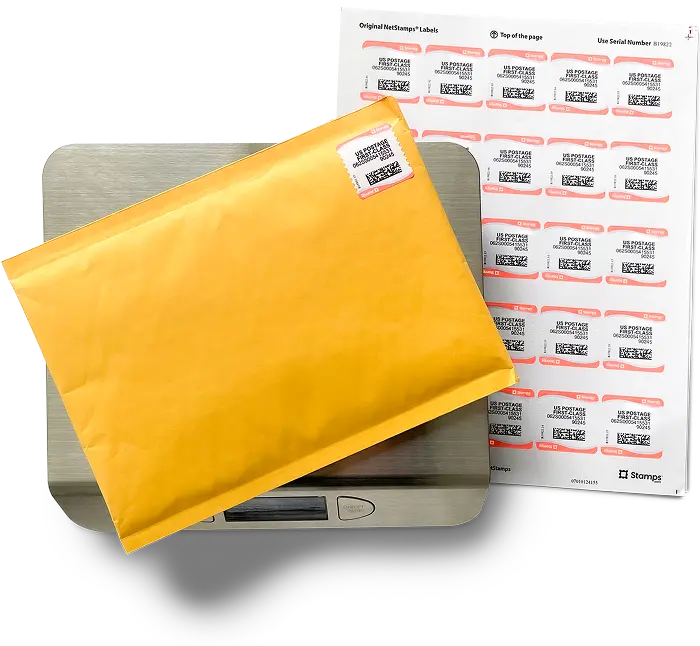
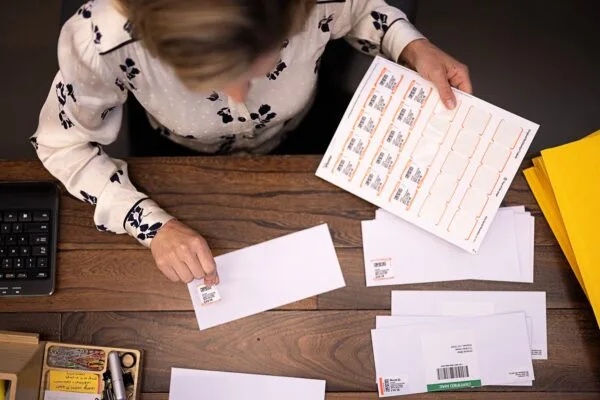
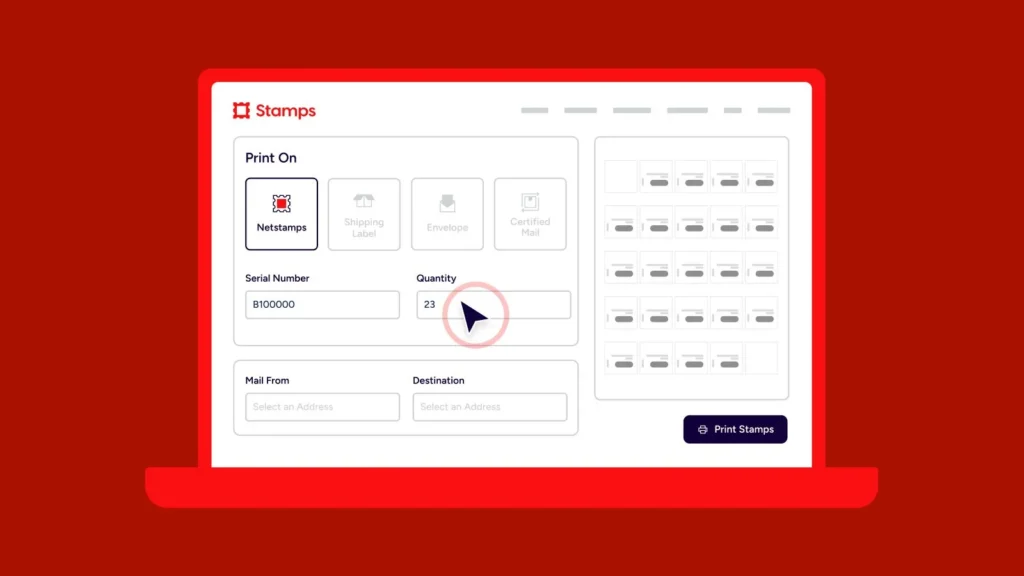
Step by step guide to printing NetStamps at home, including supplies, setup tips, and common fixes.
Winter storm delivery delays are impacting UPS, USPS, and FedEx. Get service updates and tips to keep your mail moving.
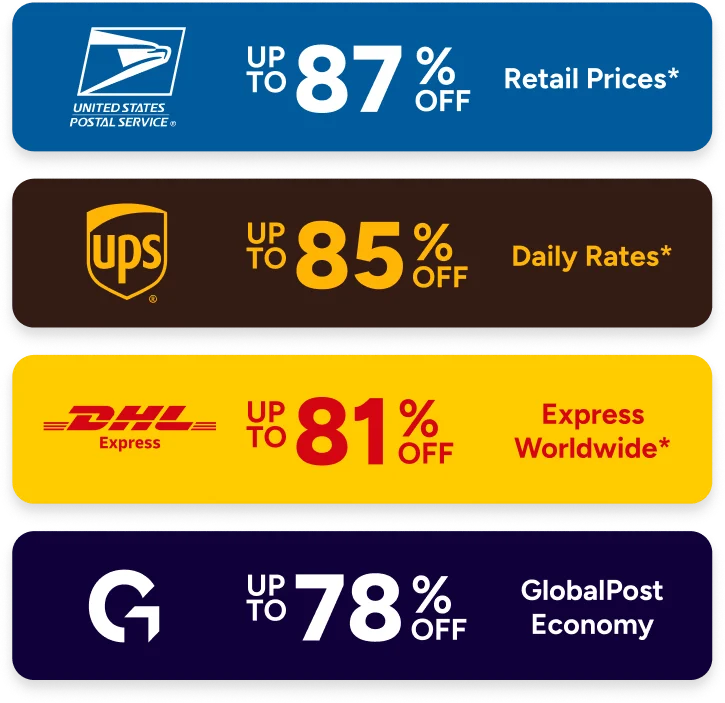
Stamps.com lets you compare all carrier rates and services all in one place, every time you ship.
Find out more about Stamps.com and its parent company.
Contact us for more information regarding media features and press enquiries.
Independent reviews of the Stamps.com software.
Get up to 87% off postage, schedule free pickups, and print stamps and labels 24/7.